
Providers' status pages
Periskopos reads the public status page of every account you connect that publishes one (GitHub, Render, Cloudflare, Supabase and most others; not Railway, Stripe, Paddle, GitLab, Neon, AWS or Google). Each incident names the parts of the provider it affects, and only those your apps use count:
- a Worker cares about Cloudflare’s Workers, not WARP;
- a connected domain adds DNS, cache and certificates;
- GitHub means Git, Actions, API and webhooks.
Supabase lists only regions, so any Supabase incident counts, and an incident that names no parts counts too.
Where you see them
Section titled “Where you see them”- Your apps get a banner, and you a notification, only for incidents in those parts (and one when it’s over).
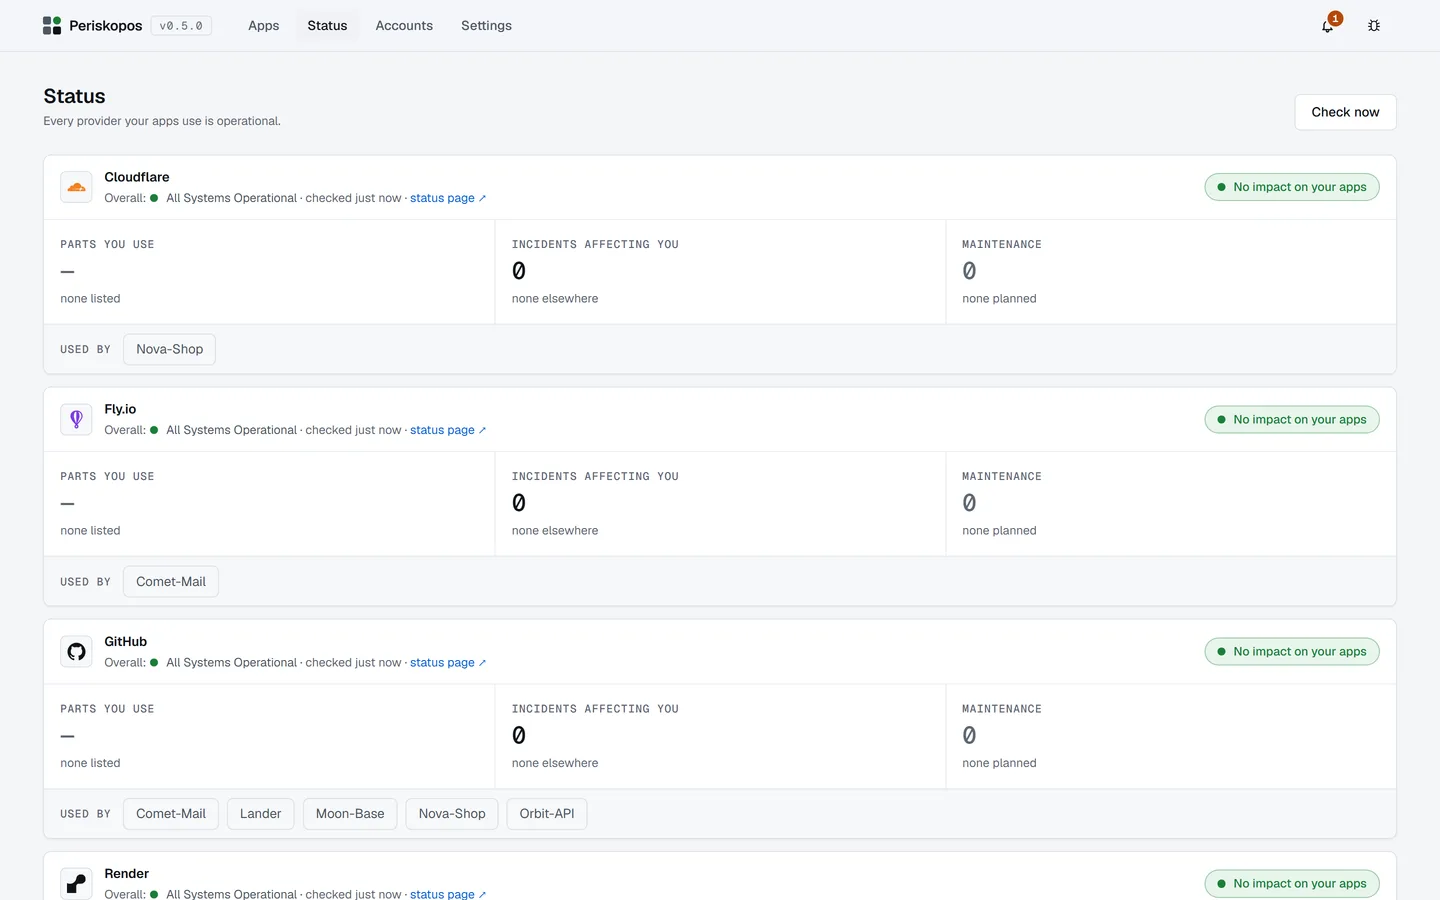
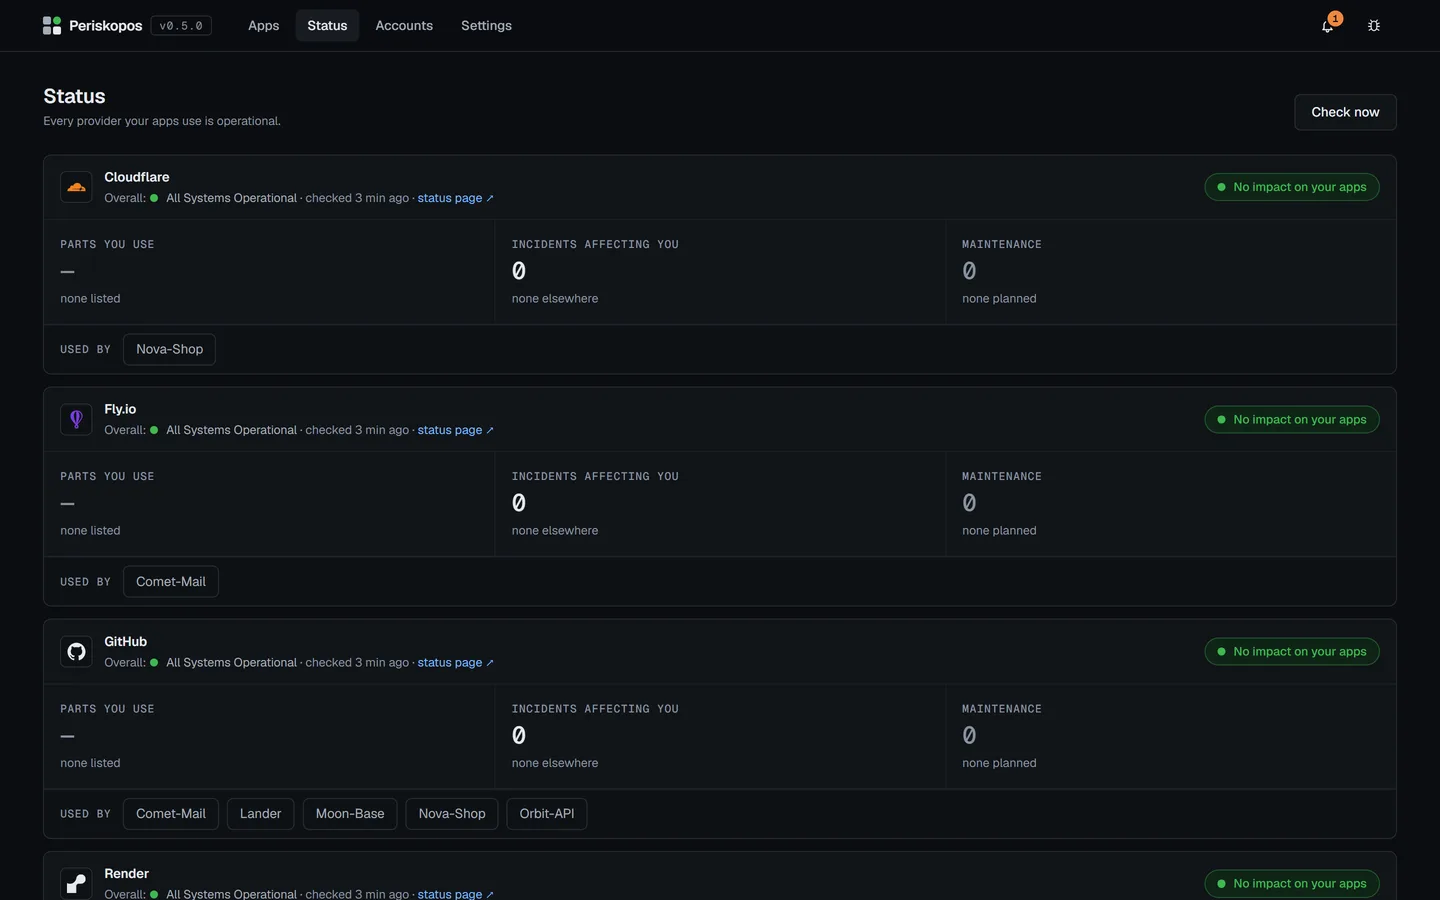
- The Status page (Status in the top bar) has a card per provider your apps use: whether it affects your apps (beside the provider’s own overall word, which may be about parts you don’t use), three numbers (the parts your apps use that are operational, incidents affecting them, maintenance planned), what’s wrong in full, the rest under More, and the apps it serves. Check now reads every status page at once. Accounts no app uses are listed below, briefly.
- The Accounts page shows each provider’s state in a line on its card, with a link to the Status page.
An alarm
Section titled “An alarm”Switch on Sound an alarm for provider incidents (Settings → Notifications) and the incident’s notification rings until you dismiss it. It needs Notify me and Provider incidents on, and doesn’t sound while alerts are paused. On Windows it’s an alarm toast that stays on screen and loops Windows’ alarm sound; a Mac plays a sound, Linux marks it critical. Test the alarm beside it lets you hear it. The all-clear stays quiet.